Grafana-to-Zendesk Alert Automation & Monitoring Dashboard
A serverless alert-to-ticket automation and monitoring dashboard for field operations — turning raw Grafana alerts into deduplicated, context-rich support tickets.
Overview
This is an internal operations and observability tool that connects Grafana alerts to a support ticketing system. It closes the gap between “an alert fired” and “support has a useful, deduplicated ticket with enough site and device context to act on.” Built on a serverless AWS architecture, it turns noisy field-equipment alerts into actionable, enriched tickets — and pairs that pipeline with a dashboard for viewing the results.
The Problem
When monitoring distributed site infrastructure, a raw alert isn’t very actionable on its own. The same condition can fire repeatedly, alerts arrive without site or device context, and support teams end up triaging duplicates by hand. The goal was to automate the path from alert to ticket while keeping the data clean, deduplicated, and enriched with the context an operator actually needs.
Architecture
The main pipeline is fully event-driven and serverless, so Grafana never waits on slower contact lookups or ticketing calls:
Grafana alert → API Gateway / Lambda → SQS → worker Lambda
  → contact lookup → DynamoDB dedupe/state → support ticket
  → status webhook back to DynamoDB
A separate read-side path powers the dashboard:
DynamoDB alert-ticket mappings + CloudWatch logs
  → FastAPI backend → React / Vite / TypeScript UI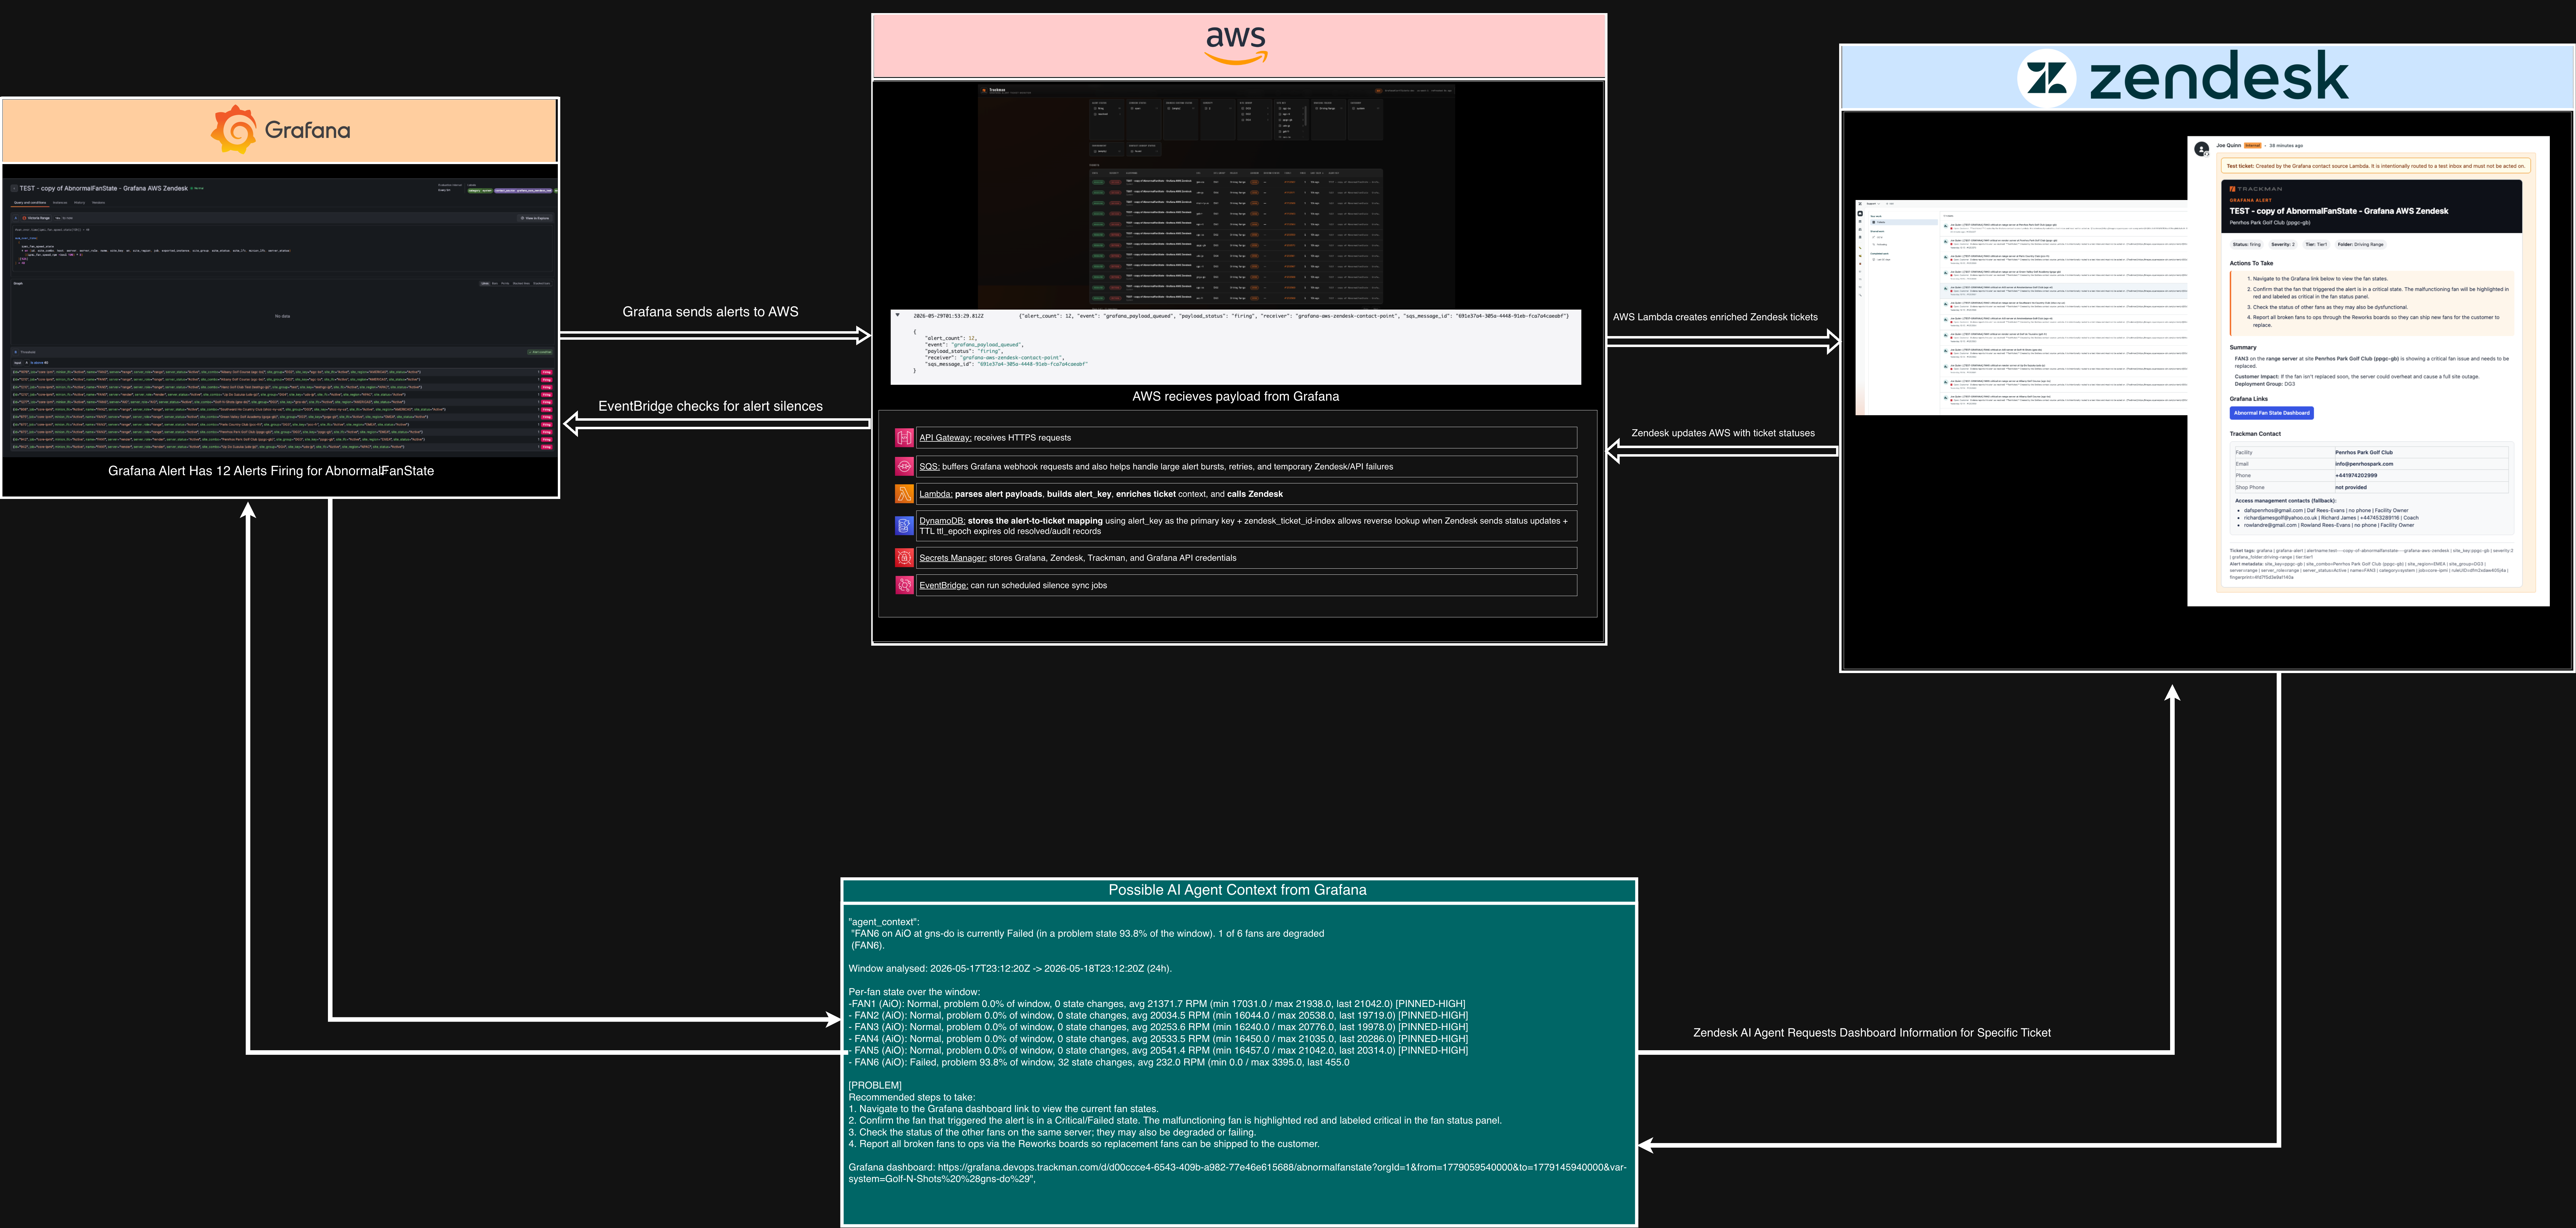
End-to-end overview: Grafana alerts flow through AWS into the support ticketing system, status syncs back into DynamoDB, and a dashboard reads the stored alert-ticket mappings and logs.
Implemented Core Pieces
- AWS SAM stack with API Gateway, Lambda, SQS, a dead-letter queue, DynamoDB, Secrets Manager permissions, and optional EventBridge silence sync.
- Webhook validation and async queueing so Grafana hands off quickly instead of blocking on downstream contact and ticketing calls.
- Worker Lambda that creates tickets, performs contact enrichment, and stores alert-ticket mappings.
- DynamoDB-backed deduplication keyed on stable alert labels, so repeat conditions don’t spawn duplicate tickets.
- Status webhook handling to sync ticket state back into DynamoDB.
- Test mode and dry-run mode for safer rollout.
- Alert-specific ticket templates, including dedicated cases like fan and server alerts.
- Monitoring dashboard (FastAPI + React) for viewing mappings, filtering, searching, grouping, opening ticket details, and inspecting logs.
- Unit tests around alert keys, security, DynamoDB behavior, SQS handling, ticket templates, silence sync, and dashboard filters.
The Dashboard
The read-side UI gives operators a single place to see which alerts produced which tickets. An overview strip surfaces fleet-wide counts — total mappings, currently firing alerts, open tickets, recent activity, and severity mix — while a filterable, groupable table lets you drill into individual alert-ticket records and jump straight to the underlying ticket.
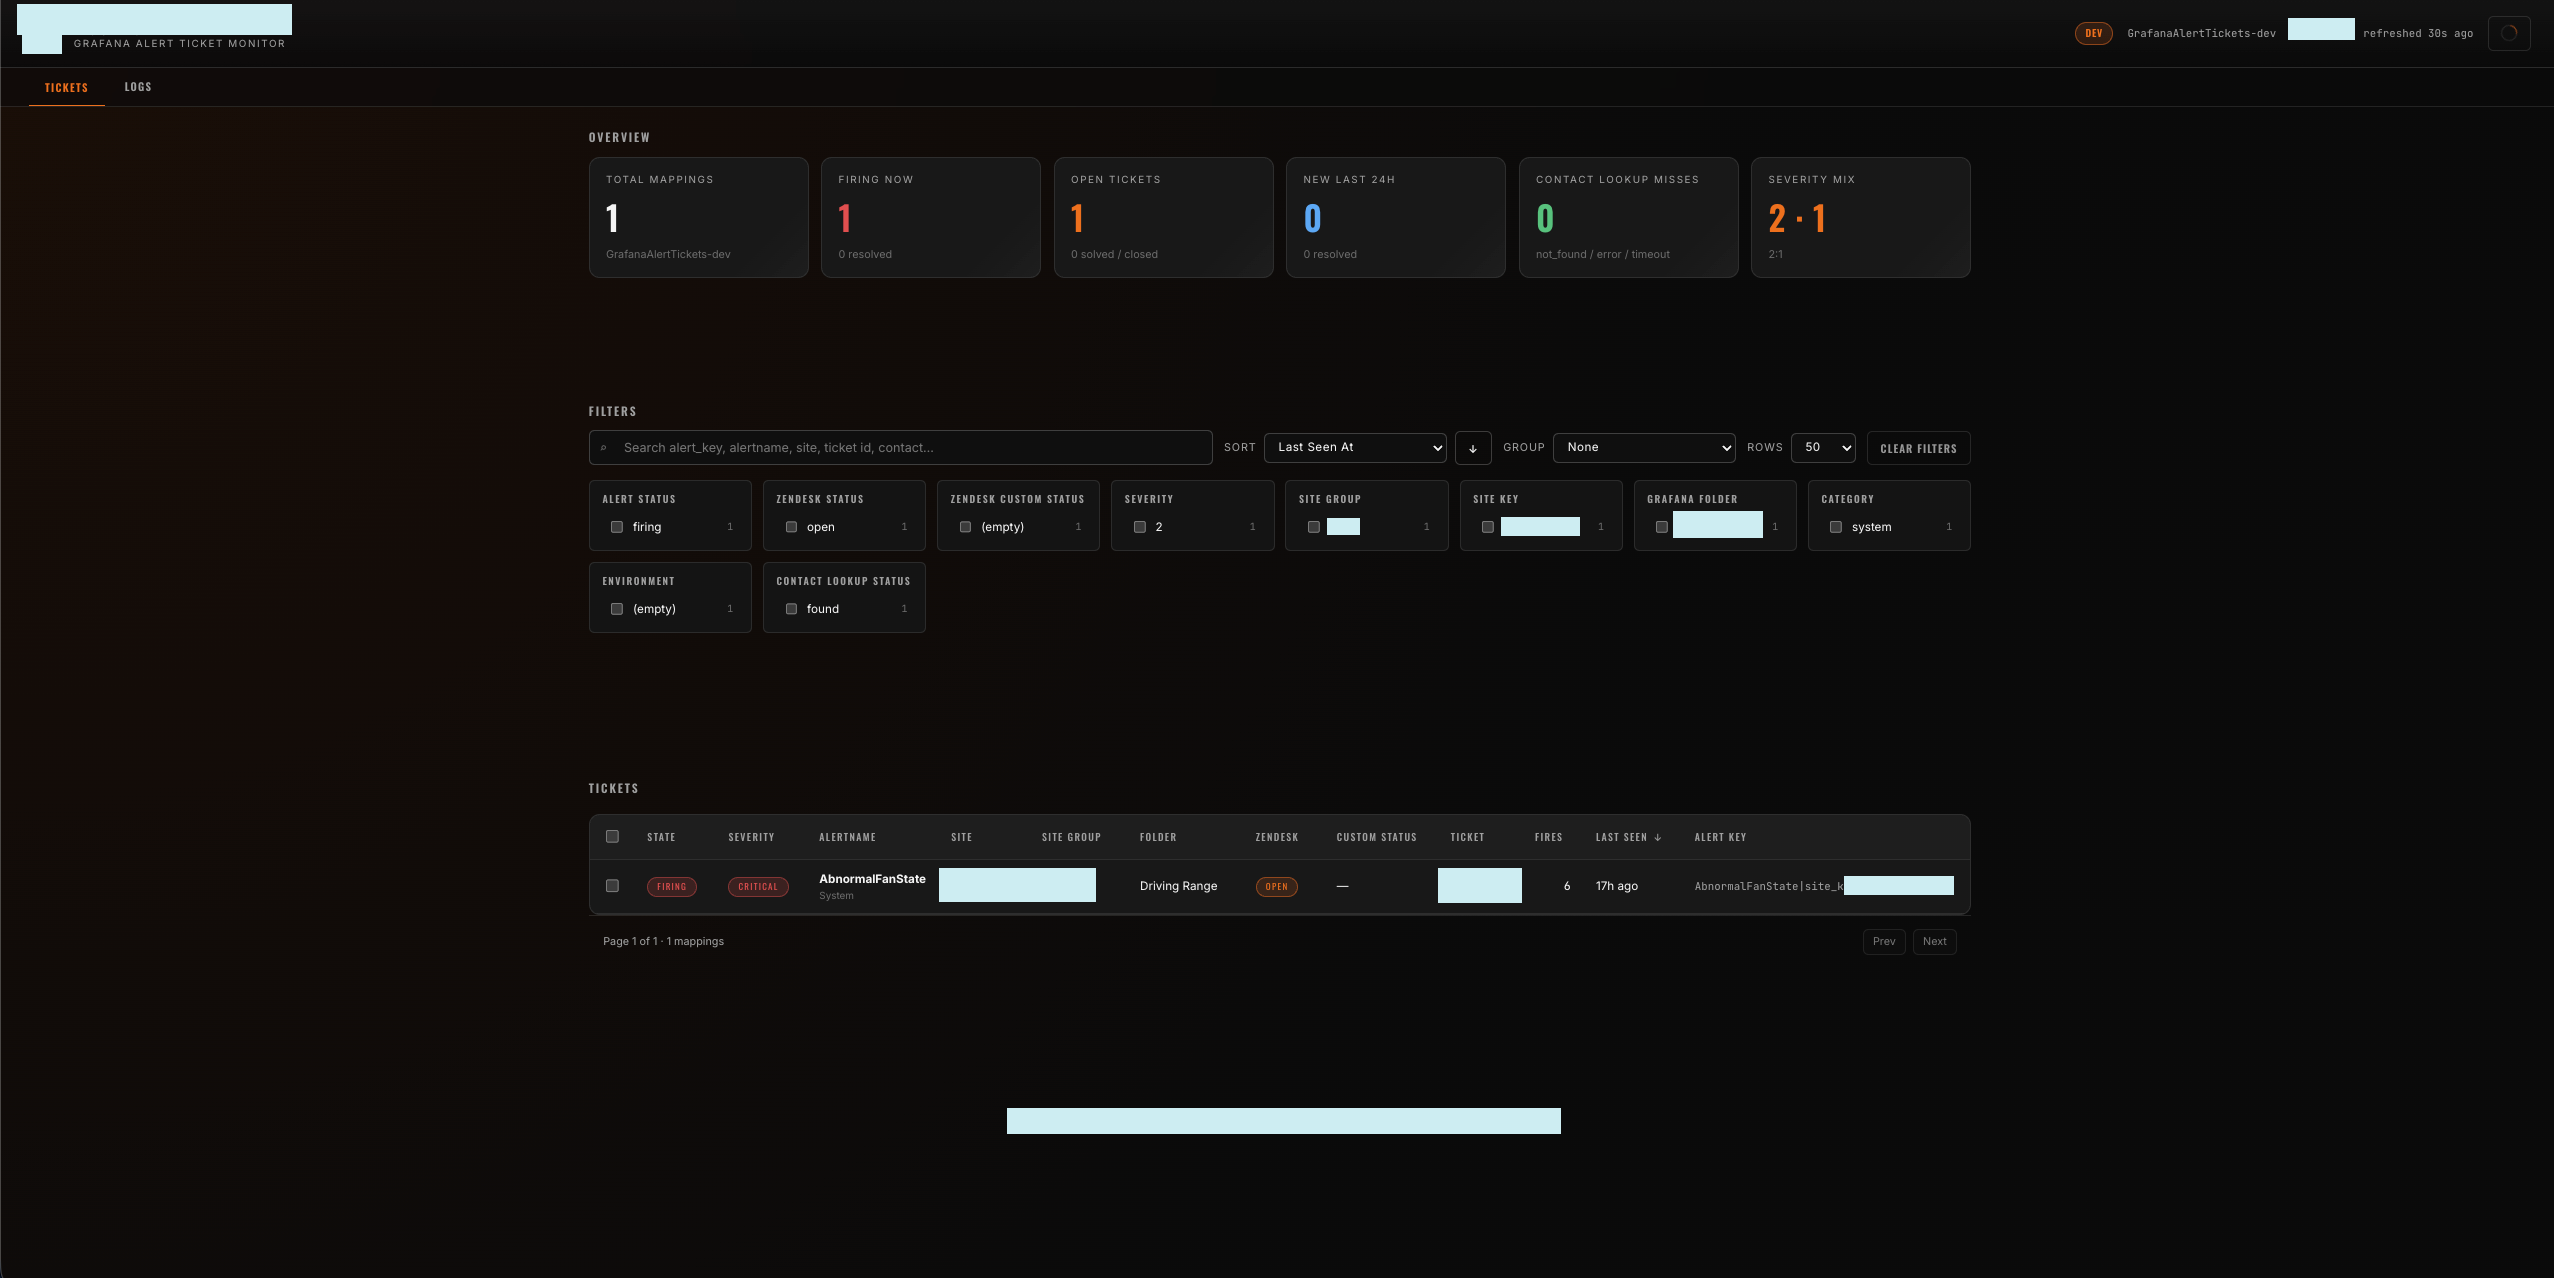
The monitoring dashboard: overview metrics, alert filters, and a searchable table of alert-to-ticket mappings with status and ticket links.
Design Decisions
- Resolved alerts update internal state but don’t auto-close tickets — a human stays in the loop on closing out support work.
- Optional Grafana silence sync is read-only and observational, and is disabled by default.
- The dashboard is access-control-agnostic by design and is intended to sit behind external authentication.
In Progress / Prototype Work
- A Zendesk AI agent fan-diagnostics service exists as a prototype/test harness — not part of the production pipeline. It combines fan metrics, runbook context, and Grafana links to generate diagnostic context.
- Earlier reference work explored Grafana silences and adjacent alerting integrations, kept around as legacy material.
Outcome
A practical, serverless operations tool that automates the full alert-to-ticket lifecycle for distributed field systems — deduplicating noise, enriching tickets with site and device context, and giving operators a dashboard to see exactly which alerts produced which tickets.