Broadcast Pipeline Monitor
A full-stack monitoring dashboard for comparing live broadcast data across two pipeline services in real time — using websockets, SignalR, Docker, DynamoDB, and a React UI to surface missing, late, or mismatched shot data during field-system workflows.
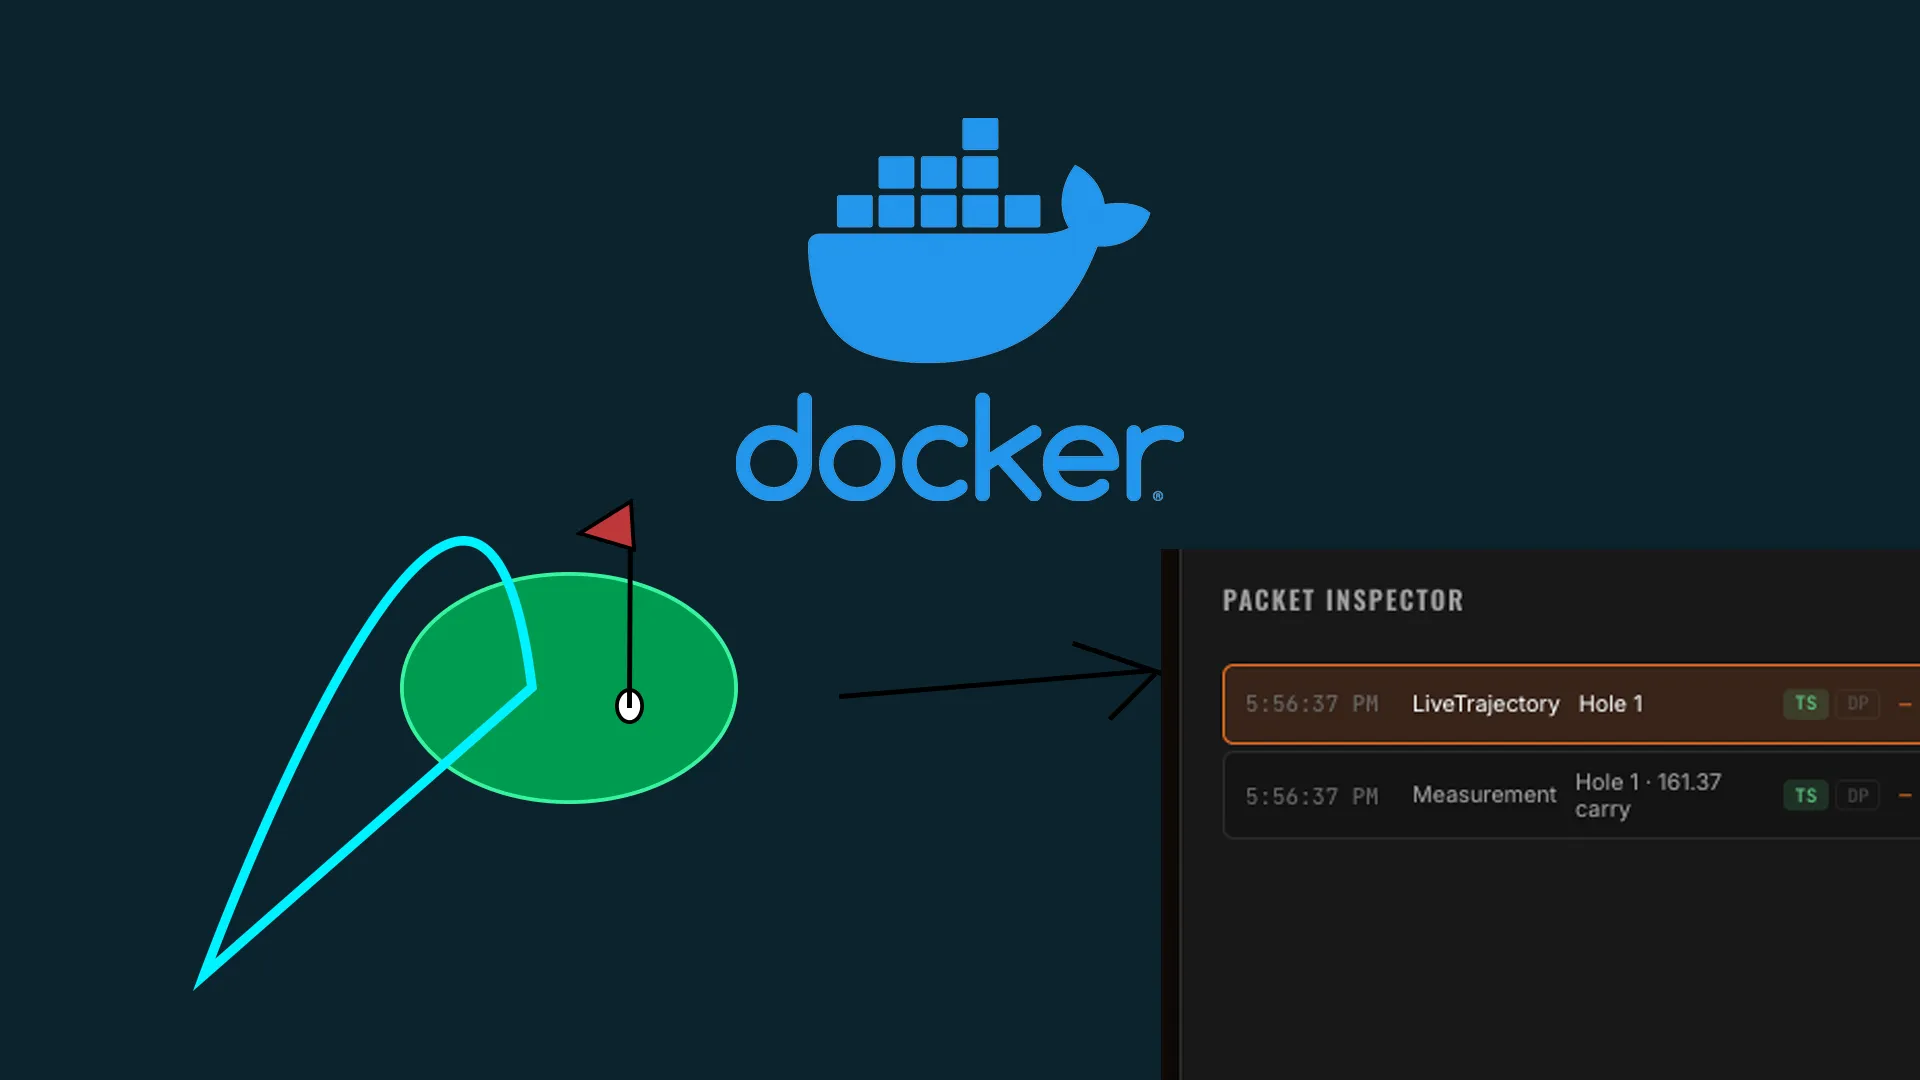
Overview
I built this as a practical support and observability tool for live sports technology workflows, where software systems are connected to physical devices and the important question is often simple: “where did the data stop flowing?” The app monitors live broadcast feeds, compares what each side of the pipeline sees, and turns that into a dashboard that’s easier to reason about during troubleshooting.
Note: the underlying broadcast pipeline and its data feeds are existing systems I did not build — this project listens to and observes that live shot data rather than producing it.
The Problem
In field systems, a device can be physically working while a pipeline is still misconfigured, disconnected, or silently failing somewhere downstream. Raw logs and scattered messages don’t make it obvious where the breakdown is. The goal was to correlate the messy operational signals — service health, pipeline state, recent broadcast activity, and container logs — into something a support or engineering team can actually act on.
How It Works
The system creates monitor sessions that connect to one or two websocket sources, subscribes to selected broadcast topics, stores the raw messages, and normalizes each incoming frame into an internal model. From there it compares message presence and timing between the feeds, identifying cases where data matched, arrived late, or only appeared on one side.
Runtime session config → websocket subscriptions → raw message ingest
  → normalized observation model → correlation / comparison engine
  → persistence → SignalR event bus → React dashboard
The support-dashboard layer adds the correlated view on top of raw comparison:
Service health + pipeline state + broadcast presence + Docker container logs
  → correlated pipeline snapshot → alert evaluation → live dashboard panels
Docker as a Core Piece
Docker ended up being central to the project, not just a packaging detail. The local development stack runs with Docker Compose — including DynamoDB Local and an initialization container for table setup — and the API and frontend use multi-stage Docker builds. The backend can discover and tail relevant service containers through the Docker Engine API using a mounted read-only socket, which deepened my understanding of container networking, environment configuration, log streaming, and the operational tradeoffs of reading logs from running containers.
Docker Compose → DynamoDB Local → table init container
  → .NET API container → React / Nginx UI container
Key Features
- Create, start, stop, restart, and clear monitor sessions.
- Connect to runtime-configured websocket broadcast feeds and subscribe to selected topics.
- Persist raw messages and comparison results.
- Compare timing and presence across two feeds — surfacing matched, late, missing, pending, and one-sided shot outcomes.
- A compact per-shot packet inspector.
- Live updates pushed to the frontend over SignalR.
- A support dashboard polling pipeline health and configuration data.
- Alert rules for mismatched or silent pipeline states.
- Container log streaming via the Docker Engine API, with filtering by source, level, and text, plus log storage footprint and buffer clearing.
- Local development with Docker Compose, including DynamoDB Local and table setup.
Technical Summary
- Backend: .NET 8 / ASP.NET Core Minimal API, websocket clients, session lifecycle management, correlation logic, and alert rules.
- Frontend: React + Vite + TypeScript dashboard with tabs for pipeline health, container logs, and broadcast packet/shot inspection.
- Real-time: SignalR live updates and live message ingestion.
- Persistence: DynamoDB and DynamoDB Local, with in-memory paths and bounded ring buffers for logs.
- Infrastructure: Multi-stage Docker builds, Docker Compose local environment, Docker Engine API log streaming over a Unix socket, and AWS CDK definitions for a cloud deployment path.
- Testing: xUnit / FluentAssertions tests around comparison, correlation, and alert behavior.
What’s Complete vs. In Progress
The completed parts include the .NET API, websocket session lifecycle, comparison logic, React dashboard, SignalR live updates, DynamoDB / in-memory persistence paths, Dockerized local development, bounded container-log buffering, and tests for the core correlation and alert rules. The AWS CDK infrastructure is present for a cloud deployment path, but the production hardening, deeper metrics/alarms, and broader observability stack are a future direction rather than finished work.
What It Demonstrates
This project sits in the area I enjoy most: software that helps make physical systems easier to operate. It touches backend engineering, real-time data, dashboards, Docker, cloud infrastructure, and support tooling — while staying grounded in a practical operational problem and the reality of debugging systems that span more than one service: websocket streams, device-adjacent data, container logs, timing issues, and partial failures.